How Custom Illustrations Enhance B2B Marketing Communication
Custom Illustrations and marketing infographics are a great way to make a complex idea or process easy to communicate and understand. They also help show the value and behind-the-scenes complexity in what may otherwise appear fairly simple. They also serve as a memorable way to break up content-heavy sections on a website or printed marketing collateral to keep readers engaged and informed.
Why Marketing Infographics and Custom Illustrations are Effective: Illustrations & Infographics Enhance Content Consumption and Retention
People learn in many different ways, but most of us have shorter attention spans and tend to scan materials instead of actually reading text. Using custom illustrations to support content “covers your bases” to make sure every type of audience can gravitate towards their preferred method of learning. In addition, adding visuals to text often creates a longer-lasting impression than text by itself.
A picture is sometimes worth a thousand words. Engineers and technical buyers want the specs and the information at their fingertips, and having it diagrammed out can only help them to understand it more quickly — and generate trust and interest in your product or process.
C suite and management level audiences appreciate process overviews that demonstrate a proven process that they can understand quickly, without needing to pore through numerous paragraphs of text content.
- Why Marketing Infographics and Custom Illustrations are Effective: Illustrations & Infographics Enhance Content Consumption and Retention
- Illustrations & Infographics Are Not Just Compelling and Attractive – They’re Also Good for SEO
- What is an Infographic?
- How to Create Compelling Custom Illustrations and Marketing Infographics for B2B Marketing
- Examples of B2B Custom Illustrations and Infographics
Illustrations & Infographics Are Not Just Compelling and Attractive – They’re Also Good for SEO
The longer a user stays on your website looking at interesting information, the better you’ll rank in search engines, leading to more traffic and potentially more conversions. Custom illustrations and marketing infographics are really just images (images that have a lot of thought put into their construction), and they exist on your site as a JPG, PNG, or GIF. Using your existing keyword research and keyword focus for the page, once your infographic or illustration is finalized, you’ll want to optimize it to include keywords in the filename, alt text, and any supporting text or captions.
For example, instead of something generic for a filename, like Image001.png, which tells search engines nothing, a better choice would be something like custom-rubber-molding-process.png. Alt text is really a description of the image, intended for screen readers for people who can’t view images in their browser, and it’s also used by search engines. An example of optimized alt text might be something along the lines of “Infographic explaining custom rubber molding process.”
Since you’ll be using a potentially large image to explain your complex process, you’ll also want to pay careful attention to file size. PNG is often the default export file type in most image editing software, and it will allow you to have a transparent background if needed, but this format can also increase file size unnecessarily. Large image file sizes equal slow load times, which will hurt your page’s reputation with the search engines (and your SEO results). Aim for a JPG at the lowest quality that looks good, or if a PNG is necessary, use a compression tool like TinyPNG.
What is an Infographic?
Before we get too much farther, let’s define what an Infographic is, vs. an Illustration. All infographics in marketing are a form of illustration, but not all illustrations are infographics.
Merriam Webster Dictionary defines “Infographic” as “a chart, diagram, or illustration (as in a book or magazine, or on a website) that uses graphic elements to present information in a visually striking way.”
In B2B marketing, we generally think of Infographics in marketing as a graphic + information. (info+graphic). An illustration can convey many things, including a depiction or likeness of something, or it could be simply decorative (we use this type of illustration less in B2B marketing and focus on conveying meaning and information). An infographic takes the informative illustration one step farther and often incorporates a good amount of text into the illustration, sometimes with the text being more prominent than any other graphic elements. Marketing infographics often convey multi-step processes, how-tos, or numerous facets of a concept. Infographics in marketing exist to help the user understand the information within the infographic, vs. merely supporting and adding visual interest to other text content (as some illustrations do).
How to Create Compelling Custom Illustrations and Marketing Infographics for B2B Marketing
Technical illustrations and process infographics for B2B and technical industries need to be more than fluff – as does all of your marketing. This means that the process can’t start by setting a designer loose to create something that just looks nice, of course.
Process definition
If the process that you want to convey has a clearly defined process written out in text form, that’s the best place to start. If you don’t have that yet, now’s the time to write down some bullet points and begin the EOS marketing & operations process of having all of your core processes documented and followed by all.
Whiteboard collaboration and wireframing
After confirming that the process definition makes sense and is understood by all internally, now is the time to review that process with your marketing or design team. Send the documented process ahead of time, so that they can review and come with questions, and then use a virtual whiteboard software tool like Google’s jamboards or an in-person session to whiteboard potential high level diagrams, to make sure that everyone understands the process in the same way.
Consider multiple structures and develop a working wireframe
There may be multiple ways to convey the subject matter – through a linear process, a flywheel that continues to loop around for continuous improvement, an exploded diagram, etc.
Consider the intended audience’s point of view
There may also be multiple points of view to consider — internally, B2B companies tend to think of a process in terms of their own operations, milestones and deliverables, but it’s useful to also step outside and think of the process in terms of how the customer experiences it, and what they get out of it. Look at or talk through several perspectives and options and determine which fits the best for visual marketing use, or for internal training, depending on the intended audience.
After collaborating, the marketing team will compose a working model or wireframe that isn’t the final “design,” but is a working diagram of the skeleton of the final infographic. Review this internally, and show it to a few other internal stakeholders and members of your intended audience to see what questions they have, and make sure they understand it in the same way that you do. Revise at this step to have a solid framework before creating the finished process illustration or infographic.
Infographic and Illustration Design
Now comes the fun part, when things start to come to life. We like to look at a few different style and icon options at this stage, before creating a high fidelity infographic, to look at options and alternatives before going too far. Once the final artwork is created, you can use it on your website, in your printed marketing materials, at trade shows, internal training, social media, and myriad other uses. Be sure to get the final files if you’re working with an external team on a one-time project, so that you can make tweaks as your process evolves over time, or as you get further feedback on how your audience understands it.
Examples of B2B Custom Illustrations and Infographics
Below are a few examples of illustrations and visual marketing infographics that we’ve created for our B2B clients to convey complex ideas or processes, help audiences understand concepts quickly, and/or to show the value that goes into their offerings. We’ve also included a few that were created by their own internal marketing teams to show a good range of what’s possible.
Medical Illustrations for a Medical Device Company
In this example, a medical illustrator on our team created drawings that focus detail on the medical device and its benefit to surgeons, eliminating extraneous detail to focus on what’s most important. The first device allows surgeons to perform a procedure with less back pain; the second reduces harmful radiation during procedures.

Custom Illustrations for Technology Company
With rural communications providers as their target market, LocaLoop required a website focused on the benefits of cloud-driven 4G in a box. We created an engaging, interactive homepage animation to help illustrate the business model while enhancing homepage interest.

Custom Illustrations for Complex B2B Services
When InboxDollars decided to redesign their corporate website, custom illustrations were important in communicating their complex business model. We created a custom animation for their homepage that in a matter of seconds explains what their core brand does—connecting targeted members to brands.
Homepage Animated Illustration: Connecting Targeted Members to Brands

Homepage Illustrations: Key Benefits

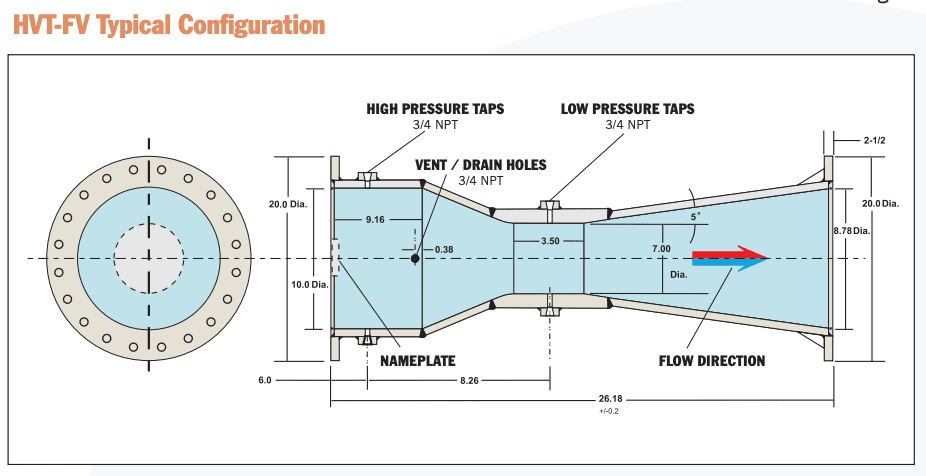
Technical Illustrations for Industrial Manufacturing Company
This type of illustration or diagram is necessary for technical products, highlighting the specifications most important to an engineer or technician and showing the most critical functions.
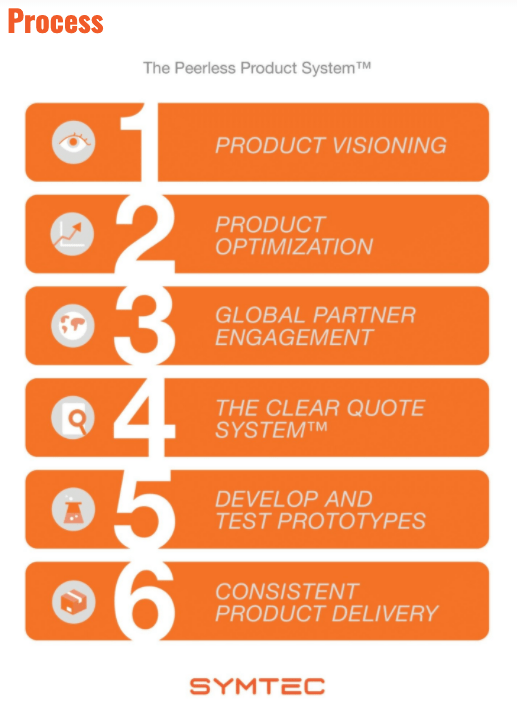
Process illustration for an Industrial Company
“How it works” illustrations or process infographics are an important part of any company’s toolbox, and they’re often easy to create in-house. Our past client, Symtec’s own marketing team created this diagram that illustrates their six step process, helping to pre-answer questions from prospects while also highlighting their value.
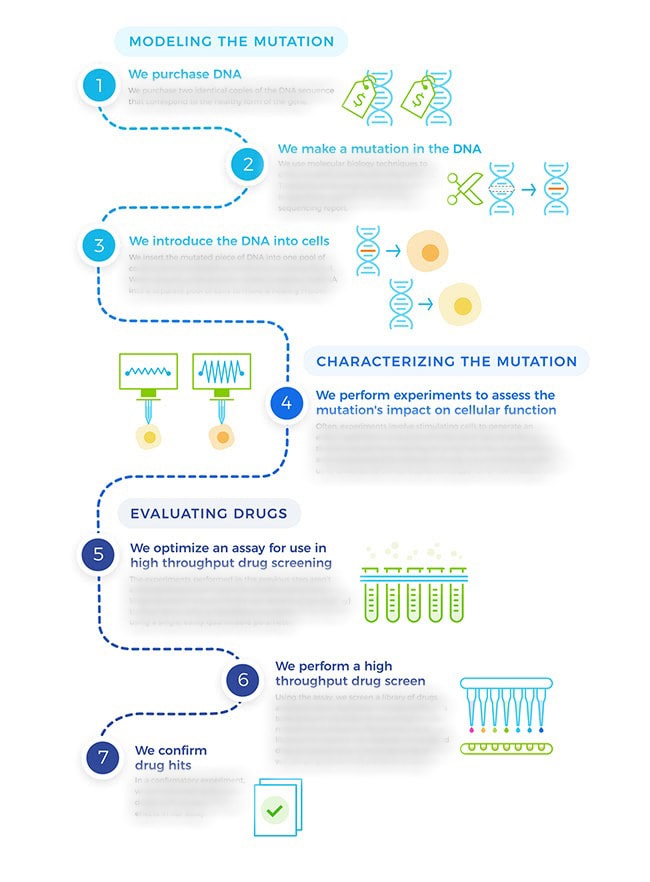
Process Infographic for Life Science Company
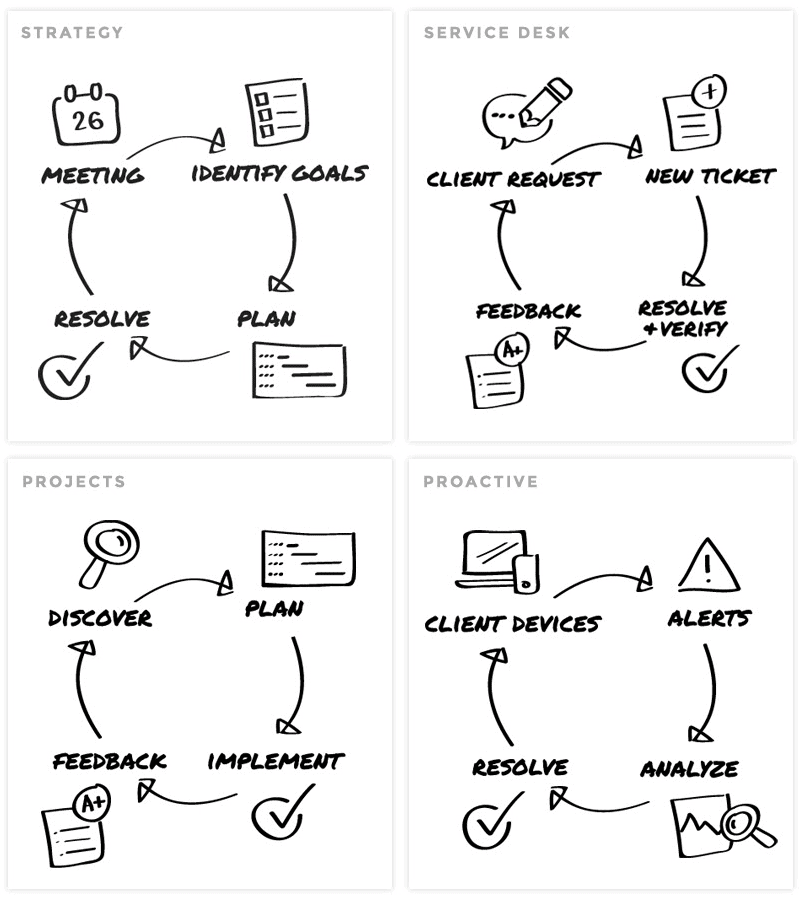
Custom Illustrations for Technology Company
An IT company was in the process of a brand refresh when they asked for our help creating custom illustrations to communicate their process and services in a simple way for potential clients to understand. We worked closely with them to understand what needed to be communicated and made recommendations on how to simplify those messages and overall visual marketing communication. The new look-and-feel direction for the illustrations is a hand-drawn effect—reflecting the company’s personable approach to IT.
Process

Services
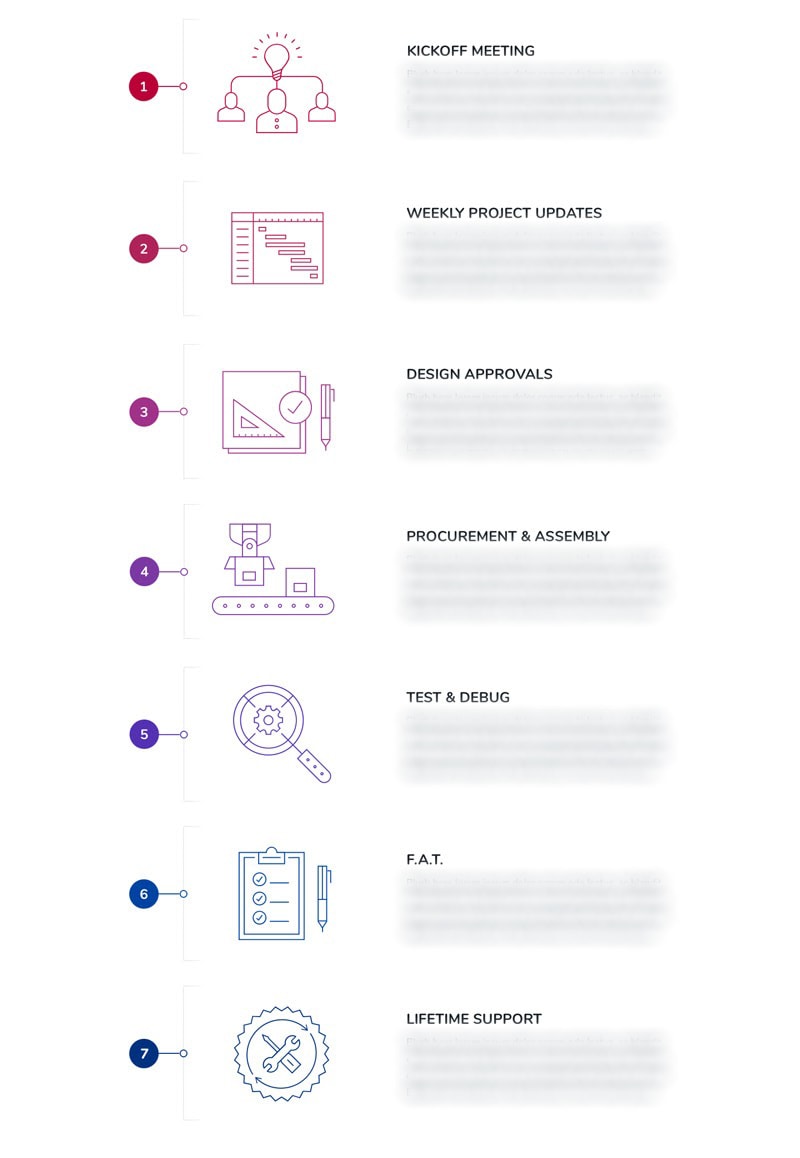
Infographic for Industrial Automation company
Here’s another example of a process diagram, utilizing custom graphics and icons to help illustrate what happens in each phase.
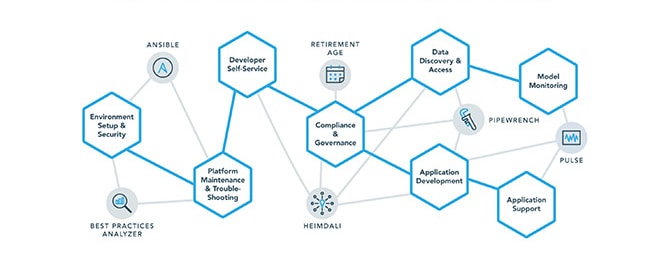
Animations and Custom Illustrations for a Big Data Company
Big data and other technical industries have complex processes and workflows. This can make marketing communication complex. Sometimes process diagrams become less linear and show a web of processes, as in this diagram for a big data organization.
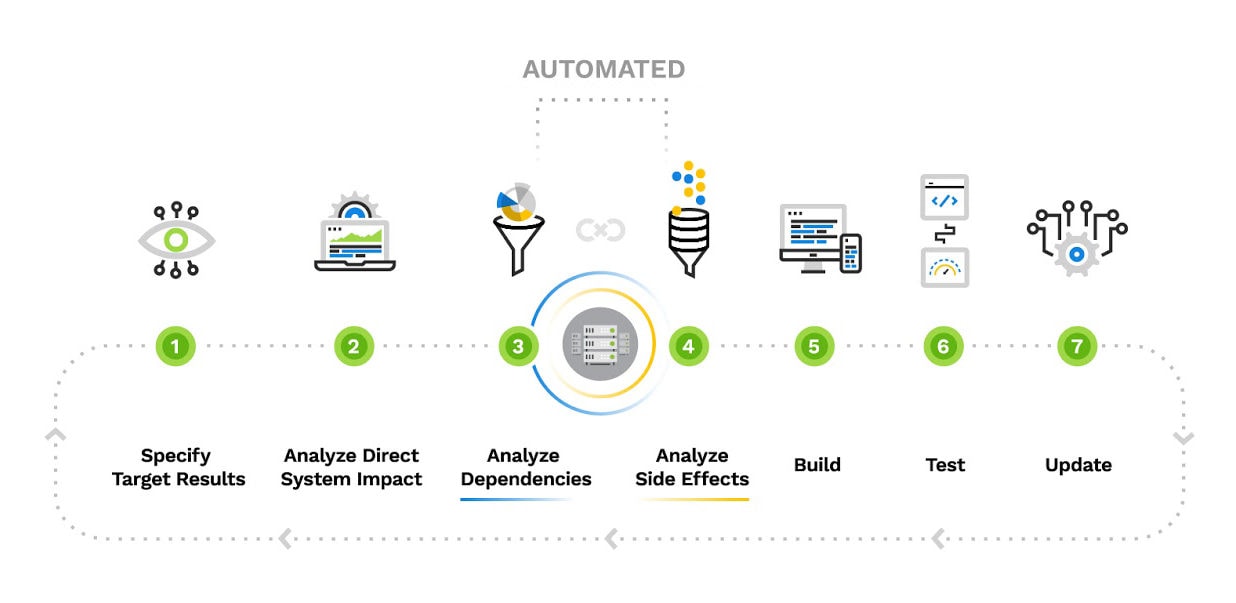
Process Infographic for B2B Technology Company
This process infographic example for a technology company highlights the part of the process that their solution automates, and shows the recurring cycle of steps.
Service line icons for B2B Technology and Security Company
These icons that we created for a B2B technology and security company accompany service lines for Strategic Services, Device & IOT Security, Infrastructure Security, Adversarial Simulation, and Application Security.
![]()
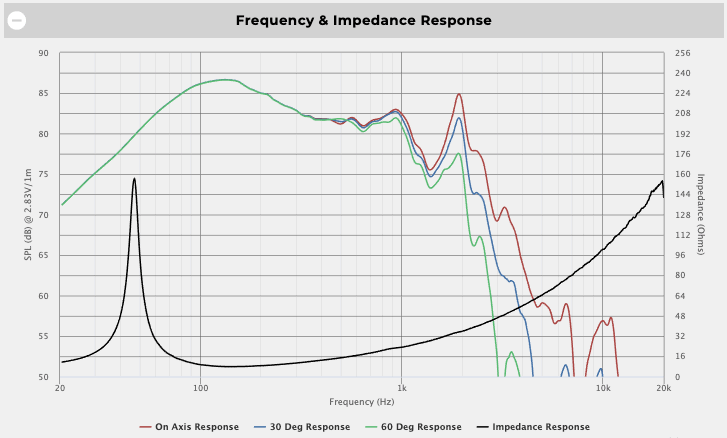
Graphs and Charts for OE Custom Manufacturer
Graphs and charts that show data and performance metrics can be created as static graphics, or generated on-the-fly to illustrate data in a more impactful way.
Process Diagram for Windmill Strategy’s B2B Website Process
And finally, here’s a simple process diagram of our website design & development process. It shows how we start with a collaborative kickoff with all major stakeholders, discussing overall goals, market positioning, competition, personas/Ideal customer profile, target keyword identification, what’s working and not working, and metrics for success. This is followed by strategy & planning, which consists of content strategy, sitemap, wireframes, keyword research, and other technical specifications. Visual design, development, training, launch, and ongoing maintenance follow. This type of visual marketing infographic is a great tool for a sales presentation — it doesn’t list all of the details, so it can’t stand alone, but it helps frame what the speaker is saying as a cohesive process. It has proven to be extremely effective towards our marketing communication goals.


